Carmignac's Note

The “income” is back in “fixed income”, but what about the “fixed”?
Carmignac’s Note
“We favour fixed income segments that offer asymmetry.”
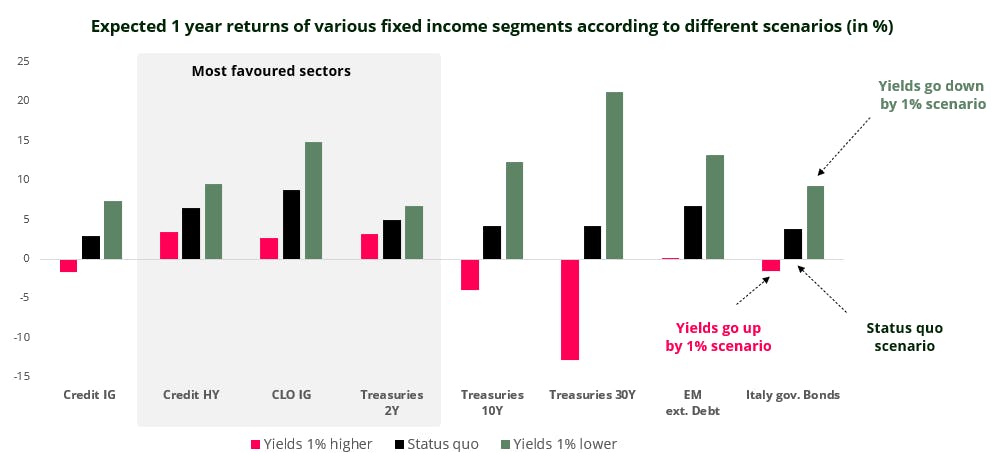
Source: Carmignac, Bloomberg as of September 2023. Yield up and down scenarios correspond to either modified duration or spread duration where most applicable.
Over the past two years, yields across fixed income segments have experienced multiple-fold increases. Core government bond yields are now out of negative territory, those on emerging market bonds have risen by a factor of two (from 4.5% to nearly 9%), and those on European high yield indices have gone from 2.3% to more than 7% – a threefold increase. And yields have now levelled off at these high rates.
The “income” is back in “fixed income” !
The rise in bond yields means that carry1 is once again a key driver of fixed income performance. This bodes well for the market, since over the long term the main contributor to a bond’s performance is its yield – that is, provided credit incidents are mitigated, which is what active managers are here for. This is especially true now that carry – rather than spread compression2 – is the main performance driver. The longer spreads stay where they are, the longer there will be attractive opportunities to seize.
So the question is: if the current situation changes and fixed income markets don’t deliver the “promised” yield (as illustrated by the black bars in the above chart), what can we expect to happen instead and what would be the impact on fixed income markets?
Is the “fixed” back in “fixed income” ?
Under our core economic scenario, we expect China's economic recovery to pick up and the US economy to remain resilient, which is likely to support the idea of a soft landing for the global economic cycle over the next six months – an environment that is particularly good for fixed income markets.
The two main risks to our core scenario are either: inflation surprises on the upside, which would push interest rates up as market participants review their expected path for disinflation and monetary-policy; or GDP growth slows sharply, which would lead to lower interest rates, especially given that real interest rates are now particularly restrictive. Both scenarios are illustrated in the above chart by the green and red bars.
It’s interesting to note that in the fixed income space, our simple yet realistic model shows that some segments would deliver positive returns under all three scenarios. Credit markets offering attractive yields, structured credit, and short-term government bonds are particularly appealing and therefore hold a decisive role in our allocation.
So now that the “income” is back in “fixed income”, investors need not worry about whether the environment will be more “fixed” in terms of interest rates.
-
The theory behind our assessment
Using a model based on simple assumptions can help us determine the expected return trajectory of a fixed income investment. The expected return of a fixed income instrument can be broken down into two components:
- The carry component, which is contingent on the yield offered by the bond.
- The price component, which is a function of the trend in bond yields (all else being equal, an increase in a bond yield has a negative impact on the bond price, and a decrease in a bond yield has a positive impact on the bond price).
As such, over the medium term – let’s say 1 year – we can calculate the gain or loss on each component.
Take a hypothetical example of an Italian government bond index.
An Italian government bond index currently yields 4% and has a modified duration of 5.4.
- Core scenario: the bond delivers a 4% carry over 1 year.
- Alternative scenario 1: bond yields are up by 1%. The return would be 4% for the carry component –5.4% for the price component = –1.4%.
- Alternative scenario 2: bond yields are down by 1%. The return would be 4% for the carry component + 5.4% for the price component = 9.4%.
- The carry component, which is contingent on the yield offered by the bond.
1Carry: Carry can be defined as the money an investor will make holding a bond after taking into account funding cost. Carry is a metric that tells investors how time will play in their favour and to what extent (or not!).
2Spread: Bond managers observe yield spreads between different types of bond to compare risk premiums. For example, when spreads narrow between government and corporate bonds, this means that the risk premium between corporate and government bonds is decreasing. As an example, a 10-year Treasury note with a yield of 5% and a 10-year corporate bond with a yield of 7% are said to have a credit spread of 200 basis points.